My friend Manish Dureja helped me redefine the Food Security Bill . So this is what Food Security Bill stands for ;
Food for Party Workers
Security for Congress &
Bill for the Tax Payers
I guess, this is the simplest definition
My friend Manish Dureja helped me redefine the Food Security Bill . So this is what Food Security Bill stands for ;
Food for Party Workers
Security for Congress &
Bill for the Tax Payers
I guess, this is the simplest definition
Indian Economy – econoquake waiting to happen, with disastrous seismic cracks
It is a known fact that when symptoms become visible for a chronic disease, complications are tough to treat and the disease is in an advanced stage, but if the disease is diagnosed in earlier stages, the diseases are easy to treat and cure. In India, now symptoms like fiscal deficit, current account deficit, increasing NPAs, inflation, unemployment, lack of investment sentiment, withdrawing of investors etc. are symptoms of a economic earth quake (what I call as econoquake), and it is like a disaster in slow motion for India.
The Indian economy has passed through its worst phase after independence since 2004 and the rot continues to grow.
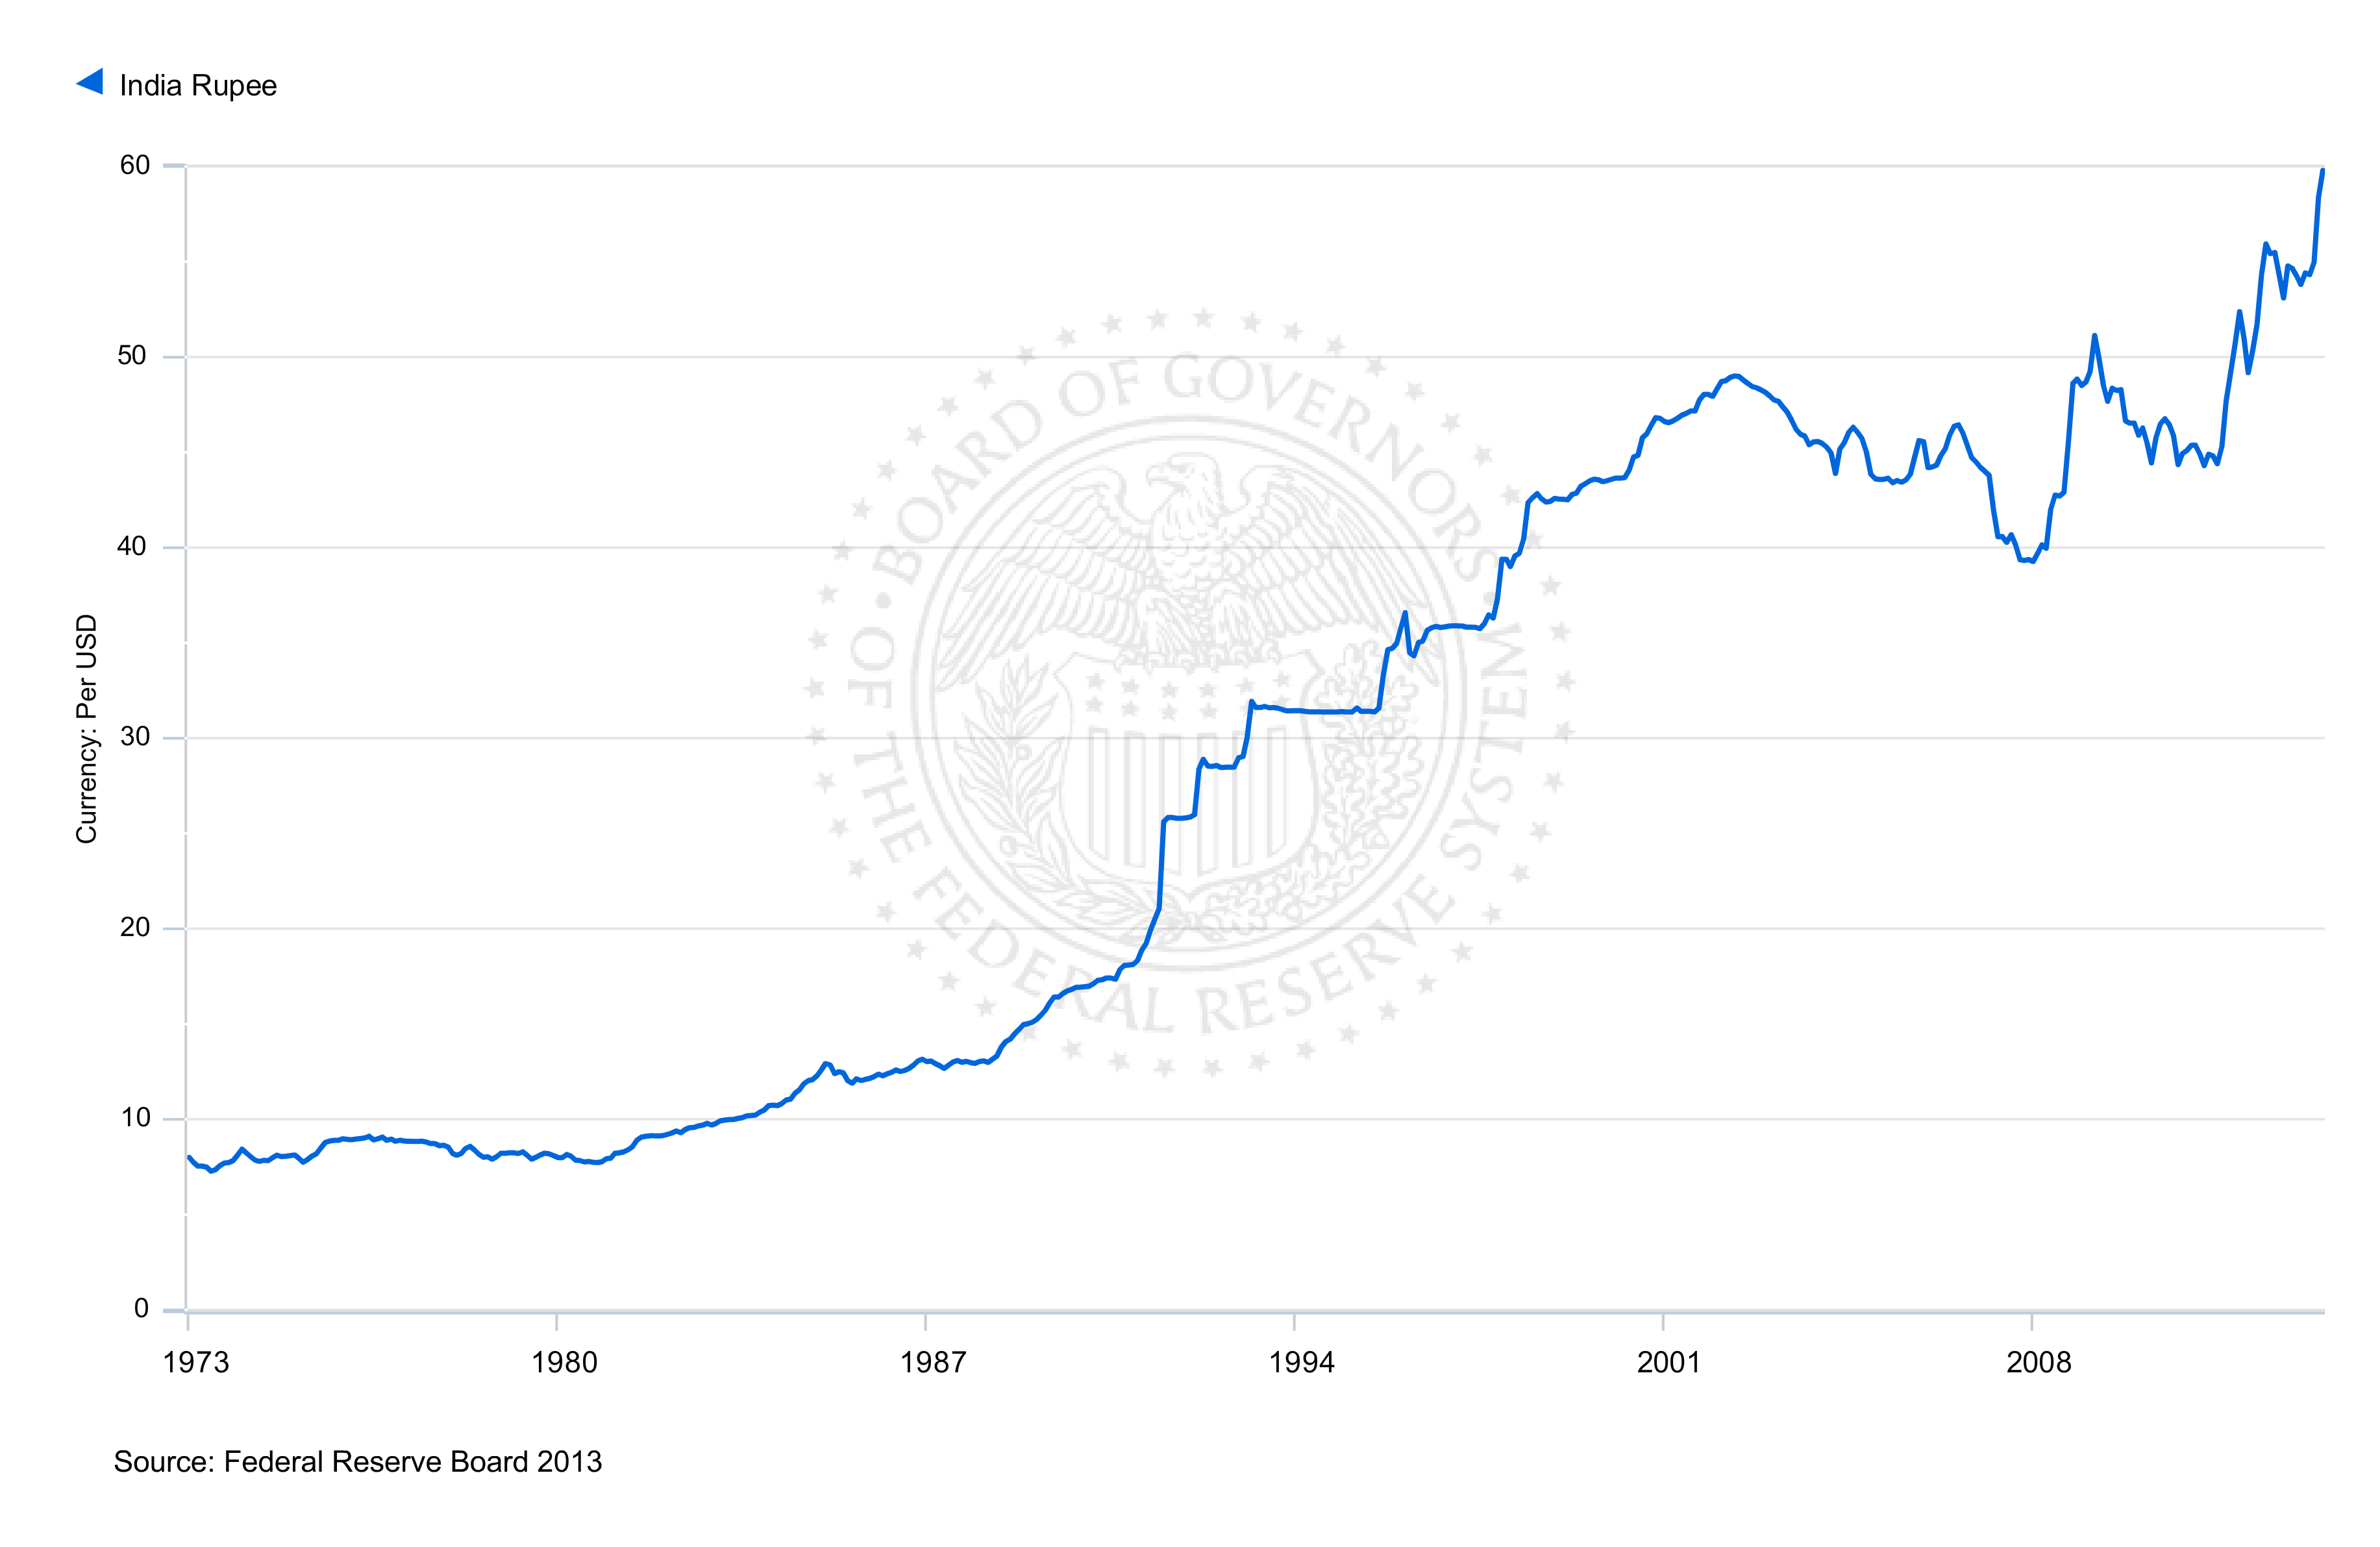
Here are some symptoms that tell how serious is the disease; Indian rupee was trading at 8 Rupee to a dollar in 1973, and has become Rs. 60 to a dollar. Does it not indicate that valuations of this country, and the fact that the economy has weakened by about 750 % in the past 40 years! Ideally, we should have grown and become 1 Rs. to 1 US $, but the poor leadership from these ‘Text Book economists’ (Manmohan Singh, Chidambaram, Montek, Subbarao) have brought down this great nation. Let us analyze a little more in detail
All the data or facts I am quoting are from credible sources and are publicily accessible . (http://blogs.economictimes.indiatimes.com/Whathappensif/entry/rbi-data-shows-how-upa-killed-the-rupee?fb_action_ids=10151534667996725)
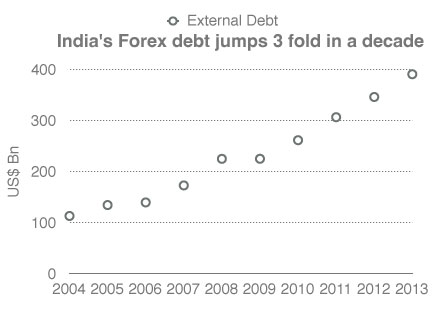
If the 10-year RBI data on short-term foreign debt is analyzed, it is fairly obvious that the UPA destroyed the value of the Rupee. In 2004 when the Vajpayee Government was voted out, the foreign debt at $ 112.4 billion was well covered by the forex reserves. Nine years later it has grown by 350 percent to $ 390 billion and the forex reserves cover falls 25 percent short.
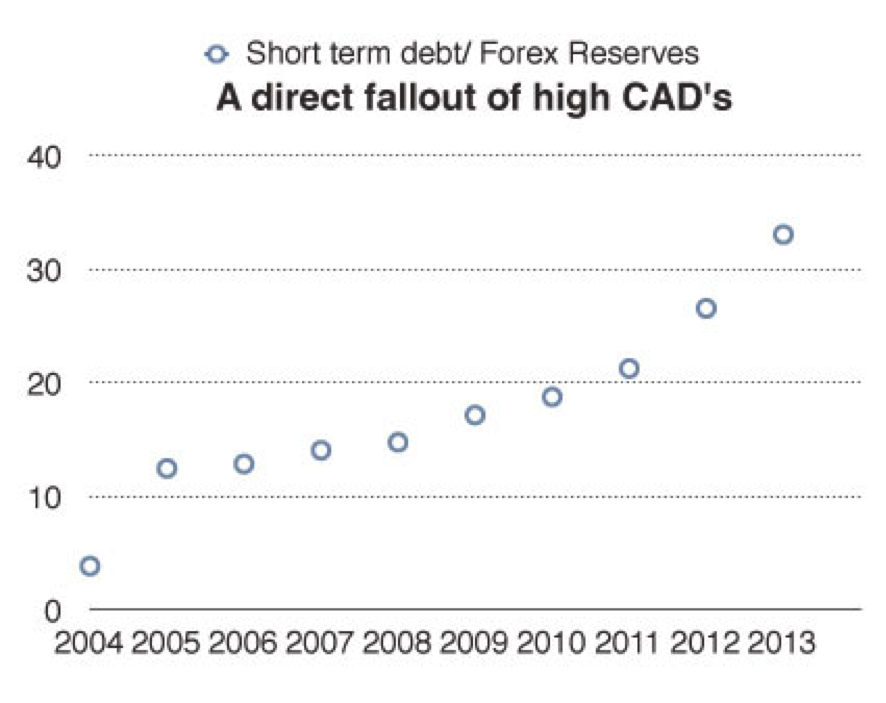
However the rise of foreign debt is not the only reason why the Rupee collapsed from Rs 39 to a dollar to Rs 61 for a dollar during the intervening period. Foreign debt is a necessary evil that is needed by developing countries to push forward their needs to fund foreign capital funded infrastructure. Usually such addition of infrastructure results in long-term asset building that adds to improved productivity of the nation. However in India’s case the rise of external debt has been primarily to fund the current account deficits catering largely to the working capital needs and funded through the short-term loan at higher interest rates. This short-term debt component was very comfortable at just 3.9 percent of the Forex reserves when the NDA was voted out of power nine years ago. By 2009 when the UPA II was re- elected it was around 17.2 percent and by March 2013 the short-term external debt rose to a whopping 33.1 percent of the Forex reserves, which had fallen to $ 292.65 billion. With the reserves further dropping to $ 280.18 billion following RBI’s intervention to stem the Rupee slide in July, the ratio would have worsened.
Short term debts and the External Commercial Borrowings that would need repayment during this FY 2013-14 is high and would cause large outflow of dollars and put pressure on the currency intermittently. For example during May 22 and June 19 there was a net debt outflow of $4.7 billion, one of the prime reasons why Rupee tanked.
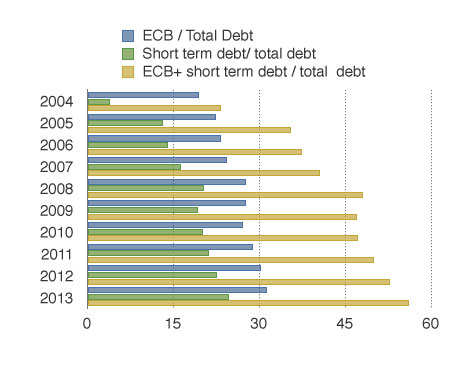
These ECB’s and short-term debt have grown to an enormous 56 percent of the total debt by March 2013 almost 2.5 times what they were when the UPA came to power nine years ago. As per RBI data short term debt payable during this Financial year is $ 96.7 billion while ECB’s with 6 month to 1 year maturity that need to be repaid are around $ 21 billion, and NRI deposits maturing during the year are $49 billion. The Rupee is catching a cold because the total foreign debt to be repaid this year works out to a massive $172 billion that is around two-thirds the foreign exchange reserves. Even if interim measures to stop speculation are taking by the RBI it will not address the inherent weakness of the system. Rather it may enhance volatility, as speculative traders if restricted will move offshore to short the Rupee.

Similarly, if we compare our neighbor, China with larger population, Chinese currency has become strong. Though, I must admit, it is not a fair comparison! But the essence is, India is also intervening to control the rupee and Chinese central bank also intervenes, but I guess they have done a better job and the Chinese currency has strengthened compared to US dollar over the past decade and the Indian rupee has not just been weakened, it has been ‘hammered’, and continues to be the worst performing currency in Asia. We can compare Malaysian Ringgit, Singapore dollar or UAE Dirham. All these currencies have strengthened against the Indian rupee
Why rupee will continue to fall?
Domestic markets are failing.
CDR gives an indication that the corporate sector is crashing!
The latest data from the CDR cell suggests that Indian banks added Rs. 15,016 Crore of restructured loans in the March quarter, about Rs. 9,000 Crore less than what they had done in the pre ceding quarter. On a cumulative basis, total restructured loans crossed Rs. 2.27 trillion, or 4.4% of the total loans given by Indian banks.
Gross non-performing assets (NPAs) of 40 listed Indian banks rose to Rs.1.79 trillion in December fromRs.1.25 trillion a year ago, an increase of 43.1%. In the past, the Reserve Bank of India (RBI) had cautioned banks about the need for enhanced risk assessment tools to monitor loan quality.
Defaults in Agricultural credit in another bubble?
A surge in exposure to farm debt through Kisan Credit Cards (KCCs) could emerge as a risk for India’s state-run banks, according to experts.
Subsidized loans are given to farmers through KCCs by state-owned banks. Until March 2012, the outstanding amount on such loans was Rs.1.6 trillion through 20.3 million cards, as per the latest Reserve Bank of India (RBI) data. This may have risen to around Rs.2 trillion, bankers said.
Agriculture is one of the largest sources of bad loans for most banks. It is contributing 9.72% to the gross NPAs of SBI and 7% of Central Bank of India. The nation’s largest lender SBI has the largest gross NPAs —Rs.53, 457.79 Crore, or 5.3% of loans, followed by Punjab National Bank (Rs.13, 997.82 Crore, or 4.61% of loans), Central Bank of India (Rs.8, 938.47 Crore, or 5.64% of loans) and UCO Bank (Rs.6, 711.29 Crore, or 5.53% of loans).
FDI is like mirage for UPA
Government’s efforts to promote India as an investment destination does not seem to be yielding fruits as FDI inflows registered 38 per cent decline to $22.42 billion in 2012-13 compared to the previous year.
It is clear that the UPA government is on the ventilator and no sensible MNC or investor is going to even announce investment for during this government. Knowing well, that the next government will certainly not be either from congress or due to its support. That is one major reason why we have seen in the last week POSCO cancelled its Rs. 30,000 Crore steel plant on July 16th, L.N.Mittal cancelled its Rs. 50,000 Crore steel plant on 17th July 2013. This is a loss of Rs. 80,000 Crore worth of investment committed to India. Normally, when the government is about to be re-elected, we know that practically, all the companies wants to wash its hands in Ganges, and get speedy approvals for obvious reasons. A ‘Needy’ political party in power wants to ‘cash in’ and so does the ‘greedy’ corporates. We have seen how business leaders get national awards like padamshree and padmavibhushan in the election years or the year preceding the election year … but this time, the scene is different. No sensible business house, no matter how ‘greedy’ it is, will commit any investment before the next general elections. So, I see no respite to Indian economy till 2014 end or may be, 2015.
FII’s the real culprits for rupee slide? May be!
FDI Inflows in India and Outflows from India from 2007 to 2012: (amount in US$ billion)
|
|
FDI Inflows to India |
FDI Outflows from India |
||||||||
|
2008-09 |
2009-10 |
2010-11 |
2011-12 |
|
2008-09 |
2009-10 |
2010-11 |
2011-12 |
|
|
|
Total |
43.4 |
35.6 |
27.4 |
36.5 |
|
19.3 |
15.9 |
15.3 |
12.6 |
|
|
As a % of GDP |
3.4% |
2.6% |
1.7% |
2.0% |
|
1.5% |
1.2% |
0.9% |
0.7% |
|
|
FDI Investment Stocks |
125.2 |
171.4 |
204.7 |
203.9 |
|
63.3 |
80.9 |
96.4 |
108.8 |
|
|
FDI Investments Stocks as % of GDP |
9.8% |
12.7% |
12.6% |
11.2% |
|
4.9% |
6.0% |
5.9% |
6.0% |
|
|
Country |
2008-09 |
2009-10 |
2010-11 |
2011-12 |
Total |
2008-09 |
2009-10 |
2010-11 |
2011-12 |
Total |
|
Singapore |
3.42 |
2.38 |
1.70 |
4.31 |
11.81 |
4.06 |
4.20 |
3.99 |
1.86 |
14.11 |
|
Mauritius |
11.04 |
10.34 |
6.98 |
8.92 |
37.28 |
2.08 |
2.15 |
5.08 |
2.27 |
11.57 |
|
Netherlands |
0.85 |
0.90 |
1.21 |
1.16 |
4.12 |
2.79 |
1.53 |
1.52 |
0.70 |
6.54 |
|
USA |
1.80 |
1.94 |
1.17 |
0.91 |
5.82 |
1.02 |
0.87 |
1.21 |
0.87 |
3.97 |
|
UAE |
0.25 |
0.63 |
0.34 |
0.33 |
1.55 |
0.63 |
0.64 |
0.86 |
0.38 |
2.51 |
|
British Virgin Islands |
No data |
No data |
No data |
No data |
No data |
0.00 |
0.75 |
0.28 |
0.52 |
1.55 |
|
UK |
0.83 |
0.66 |
0.76 |
2.75 |
5.00 |
0.35 |
0.34 |
0.40 |
0.44 |
1.53 |
|
Cayman Islands |
No data |
No data |
No data |
No data |
No data |
0.00 |
0.04 |
0.44 |
0.14 |
0.62 |
|
Hong Kong |
No data |
No data |
No data |
No data |
No data |
0.00 |
0.00 |
0.16 |
0.31 |
0.46 |
|
Switzerland |
No data |
No data |
No data |
No data |
No data |
0.00 |
0.00 |
0.25 |
0.16 |
0.41 |
|
Other Countries |
No data |
No data |
No data |
No data |
No data |
7.65 |
3.19 |
2.65 |
1.23 |
14.71 |
|
Japan |
0.41 |
1.18 |
1.56 |
2.75 |
5.90 |
No data |
No data |
No data |
No data |
No data |
|
Cyprus |
1.30 |
1.63 |
0.91 |
1.32 |
5.16 |
No data |
No data |
No data |
No data |
No data |
|
Germany |
0.60 |
0.63 |
0.20 |
1.46 |
2.89 |
No data |
No data |
No data |
No data |
No data |
|
France |
0.46 |
0.30 |
0.73 |
0.47 |
1.96 |
No data |
No data |
No data |
No data |
No data |
References:
(1) OECD data on FDI in Figures as on January 15, 2013.
(2) Zenith International Journal of Business Economics and Management Research, July 2012.
(3) World Investment Report various issues.
(4) If there are any inadvertent errors in the data, it is regretted
Please see how foreigners are investing money in stock markets, and have taken over 100 Billion USD (108.8 Billion dollars, Which is 6 % of India’s GDP) outside India just in one year (2011-12).
How will our Finance Minister address the Balance of payment issue, which needs 75 billion USD?
11 % of GDP is in the hands of FDI / FIIs? Are we safe? Is our growth trickling down or trickling outward? This is in complete deviation of the path of a self-reliant India propounded by our freedom fighters. We are not building a West India company on the lines of the erstwhile East India Company? Time to take a serious look at the data and take concrete actions. It is a wake-up-call for India
Dr.Akash Mehta compiled this data on FII’s on my request. Acknowledged with thanks Dr.Mehta.
Vehicle sales – another symptom of the anemic economy
Car sales in India fell for a record eighth month in row in June with a dip of 9 percent as economic slowdown and low consumer sentiments continue to hit demand, prompting industry body SIAM to seek stimulus package for the automobile sector from the government.
With actual sales in the first quarter of this fiscal turning out to be wide off the mark from what it had forecast in April, Society of Indian Automobile Manufacturers (SIAM) stayed away from revising sales projections it had made in April this year and stated that even those targets were unlikely to be met, except in two-wheeler segment.
According to the latest figures, domestic car sales stood at 1,39,632 units in June as against 1,53,450 units in the same month last year.
We know the problem. So what next?
India has focused too much on FDI / FII’s to bring in dollars, and the capitalists countries are like Shylock (Merchant of Venice). They will extract their pound of flesh. So, India got quick dollars from FII’s, and FII’s made quicker returns and exited the markets and today FIIs have 11 % of the investment in stocks, as I have given the data above. The fact is that, a clutch of foreign investors can destabilize India by withdrawing their investment. FIIs are short-term hedgers and they damage infringe long-term damage to our currency & country. Small retail investors become bankrupt because of FIIs. What came out as a myopic solution to our fiscal deficit and balance of payment crises has today turned into a major national security issue?
Economic Competitiveness: We need to focus on economic competitiveness. We have lost in the last few decades.
Areas to focus, agriculture – we need to amulify agriculture (taking a cue from Amul’s experiment of cooperative movement in milk). We need to support farmers. Make a paradigm shift in modernizing agriculture, training, and equipping farmers to set up SME food processing units. This should make us the top most processed food country in the world in the next decade. The national highways project of Shri. Vajpayee (Golden Quadrilateral Project) was the best step taken since independence for inclusive growth, and this must be pursued aggressively. During NDA regime the road building was 20 KMs a day and under UPA it is down to a KM or two. The Atal Behari Vajpayee government bequeathed a robust economy to the UPA. Remember that the growth rate registered in 2003-04, the last year of the NDA regime, was an impressive 8.5%. Foreign exchange reserves were plentiful. General prices were well under control. Share markets were booming. And there was a general sense of well-being. Work on the Golden Quadrilateral highway linking four corners of India was on in full swing. And various public infrastructure projects under the Public-Private-Partnership model were proceeding without any hitch.
Now, in the last year of the UPA-II, we are back to the Hindu rate of growth. If the economy logs anything above 5% it would be a miracle
(http://www.sunday-guardian.com/analysis/back-to-where-the-economy-was-during-the-early-90s)
My personal prediction is, that we will be below 4 % in growth soon if the regime continues the same way and I have predicted it long back
(https://commonmansblog.com/2013/06/04/the-titanic-is-sinking-can-we-do-something/)
Tourism- spiritual tourism – Tourism is the next best bet after agriculture and we must focus on it by innovating in this sector. I have detailed plan for creating millions of jobs and billions of dollars through employing matriculate youths in this sector.
Intellectual property (IP): India has become a sweatshop and nothing wrong in it, but we need to focus on building IP in science, technology, defense, & agriculture. It is shame that India has not even built a software platform (operating system) and still relies on Microsoft and IOS. Indians in software arena should take a challenge and build the best operating system rather than spending billions of dollars buying MS Office and Apple operating system or Google. We need a search engine developed by Indians. India spends billions of dollars on universities but the IP registered by just one company Texas Instruments (for the sake of giving example I am quoting Texas Instruments) from its Bangalore office might exceed the patents granted to researchers in Indian universities. We need a complete over haul in our education systems that give the world the most valuable IPs, which can be monetized.
Geographical indicators (GI’s): We all are aware that many Geographical Indications like Darjeeling Tea, Mysore Silk, and Champagne across the world have become premium global products. While protection of GIs is very important, it is all the more important to extract economic benefit out of registered GIs. In India we have 184 Indian GIs has been registered till now but hardly a few of them have accessed global market.
On the other hand we are also seeing growing number of GIs from other countries like Peruvian Pisco, Scotch whisky, Cognac, Prosciutto de Parma, Tequila etc. have registered in India.
While it is understood that not every Indian GI has the potential of capturing global market, but many of them have. However we have not seen enough initiative and support system for such promising GIs having healthy export market. There must be a plan to build on the legacy of these GI’s, and targeted GI must be turned into a USD 10 billion global markets for Indians.
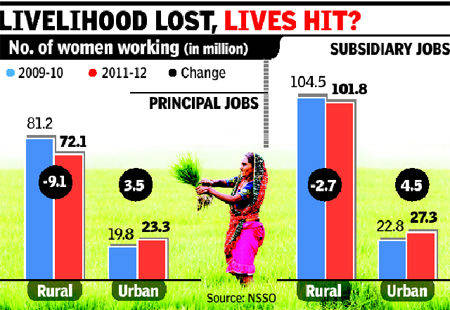
Boost manufacturing with a focus on SME’s: Women’s employment has taken an alarming dip in rural areas in the past two years, a government survey has revealed. In jobs that are done for ‘the major part of the year’, rural women lost a staggering 9.1 million jobs. This emerges from comparing employment data of two consecutive surveys conducted by the National Sample Survey Organization (NSSO) in 2009-10 and 2011-12. NDA, during 1999-2004, 60.7 million jobs were created while UPA Government, during 2004-2009, created only 2.7 million jobs. (Data source: National Sample Survey Office).
Organic farming, Herbals & Nutraceuticals: The whole world is moving to traditional and complimentary medicine and India has a scientific traditional medicine dating back to 5000 years. We can create rotation farming for herbals and organic foods and create millions of jobs and billions of dollars worth of exports.
Foreign policy: Neighbors can help. We need not be hooked to G8 / 14/ 20. It is time to have a strategic alliance in Asia, A-2 (India and China) on the lines of G-4, we need to create A-4, the big 4 Asian economies must come together to lead Asia. This is where India must initiate moving from G-20 to A-4.
Lastly, it would not be wrong to say that lakhs of small and medium enterprises , and even 27 big corporate houses have 41 trillion rupee debts (http://www.livemint.com/Companies/7TnLNfHilL2UOkPVNku8UM/Kumar-Mangalam-Birla-is-the-highestpaid-director.html ) . So , this is a steriod induced survival for most of the corporate entitites be it small or big .More pain is expected by this year end. So the government needs to keeps its head low and overheads lower and find solutions to avoid NPA’s . Though, it is an another thing, that UPA has in itself become an NPA.
Rajendra Pratap Gupta
Global Economic Outlook 2013
http://www.conference-board.org/data/globaloutlook.cfm
The global economy has yet to shake off the fallout from the crisis of 2008-2009. Global growth dropped to almost 3 percent in 2012, which indicates that about a half a percentage point has been shaved off the long-term trend since the crisis emerged. This slowing trend will likely continue. Mature economies are still healing the scars of the 2008-2009 crisis. But unlike in 2010 and 2011, emerging markets did not pick up the slack in 2012, and won’t do so in 2013. Uncertainty across the regions – from the post-election ‘fiscal debate’ question in the U.S. to the Chinese leadership transition and reforms in the Euro Area – will continue to have global impacts in sluggish trade and tepid foreign direct investment.
Main results:
Global Outlook for Growth of Gross Domestic Product, 2013-2025 (May 2013)
Europe includes all 27 current members of the European Union, as well as Iceland, Norway, and Switzerland.
**Other advanced includes Canada, Israel, Korea, Australia, Taiwan, Hong Kong, Singapore, and New Zealand.
***Southeast Europe includes Albania, Bosnia & Herzegovina, Croatia, Macedonia, Serbia & Montenegro, and Turkey.
Source: The Conference Board Global Economic Outlook 2013, May 2013 update
Global Outlook for Growth of Gross Domestic Product, 1996-2013 (May 2013)
|
1996 – 2005 |
2006 – 2012 |
2012 |
2013 |
||||||
|
Distribution of World Output 2012 |
GDP Growth |
Contribution to World GDP growth**** |
Projected GDP Growth |
Contribution to World GDP growth**** |
Projected GDP Growth |
Contribution to World GDP growth**** |
Projected GDP Growth |
Contribution to World GDP growth**** |
|
| United States |
18.2% |
3.3 |
0.7 |
1.1 |
0.2 |
2.2 |
0.4 |
1.6 |
0.3 |
| Europe* |
20.3% |
2.4 |
0.6 |
0.9 |
0.2 |
-0.2 |
0.0 |
0.3 |
0.1 |
| of which: Euro Area |
13.8% |
2.2 |
– |
0.7 |
– |
-0.5 |
– |
0.1 |
– |
| Japan |
5.6% |
1.0 |
0.1 |
0.2 |
0.0 |
0.6 |
0.0 |
0.8 |
0.0 |
| Other advanced** |
7.2% |
4.0 |
0.3 |
3.0 |
0.2 |
2.2 |
0.2 |
2.8 |
0.2 |
| Advanced Economies |
51.3% |
2.7 |
1.7 |
1.2 |
0.7 |
1.1 |
0.6 |
1.2 |
0.6 |
| China |
16.4% |
8.1 |
0.6 |
10.4 |
1.3 |
7.8 |
1.2 |
7.5 |
1.2 |
| India |
6.3% |
6.5 |
0.3 |
7.8 |
0.4 |
5.5 |
0.3 |
4.7 |
0.3 |
| Other developing Asia |
5.3% |
3.9 |
0.2 |
5.0 |
0.2 |
5.3 |
0.3 |
5.0 |
0.3 |
| Latin America |
7.7% |
2.8 |
0.2 |
3.7 |
0.3 |
3.1 |
0.2 |
3.0 |
0.2 |
| Middle East |
3.7% |
4.6 |
0.1 |
4.3 |
0.2 |
5.5 |
0.2 |
2.2 |
0.1 |
| Africa |
3.3% |
4.6 |
0.1 |
4.7 |
0.1 |
3.7 |
0.1 |
4.2 |
0.1 |
| Russia, Central Asia and Southeast Europe*** |
5.9% |
4.0 |
0.2 |
4.0 |
0.2 |
3.6 |
0.2 |
2.9 |
0.2 |
| Emerging and Developing Economies |
48.7% |
5.0 |
1.8 |
6.5 |
2.8 |
5.5 |
2.6 |
5.0 |
2.4 |
| World Total |
100.0% |
3.6 |
3.5 |
3.2 |
3.0 |
||||
*Europe includes all 27 current members of the European Union, as well as Iceland, Norway, and Switzerland.
**Other advanced includes Canada, Israel, Korea, Australia, Taiwan, Hong Kong, Singapore, and New Zealand.
***Southeast Europe includes Albania, Bosnia & Herzegovina, Croatia, Macedonia, and Serbia & Montenegro, and Turkey..
****The percentage contributions to global growth are computed as log differences and therefore do not exactly add up to the percentage growth rate for the world economy.
Source: The Conference Board Global Economic Outlook, May 2013 update.
Comparison of Base Scenario with Optimistic and Pessimistic Scenarios, 2013 – 2025 (May 2013)
|
2013 – 2018 |
2019 – 2025 |
||||||
|
GDP Growth in Optimistic Scenario |
GDP Growth in Base Scenario |
GDP Growth in Pessimistic Scenario |
GDP Growth in Optimistic Scenario |
GDP Growth in Base Scenario |
GDP Growth in Pessimistic Scenario |
Distribution of World Output 2025 |
|
| United States |
2.5 |
2.3 |
2.1 |
2.4 |
2.0 |
1.6 |
18.3% |
| Europe* |
1.5 |
1.2 |
0.8 |
1.6 |
1.3 |
0.9 |
17.4% |
| of which: Euro Area |
1.4 |
1.1 |
0.8 |
1.6 |
1.3 |
1.0 |
12.0% |
| Japan |
1.3 |
0.9 |
0.5 |
1.2 |
0.9 |
0.7 |
4.8% |
| Other advanced** |
3.5 |
2.6 |
1.7 |
2.5 |
1.8 |
1.2 |
7.3% |
| Advanced Economies |
2.1 |
1.8 |
1.4 |
2.0 |
1.6 |
1.2 |
47.8% |
| China |
8.0 |
5.8 |
3.7 |
4.9 |
3.7 |
2.5 |
22.7% |
| India |
5.7 |
4.7 |
3.6 |
4.5 |
3.8 |
3.2 |
8.2% |
| Other developing Asia |
6.4 |
5.0 |
3.6 |
5.5 |
4.4 |
3.2 |
4.9% |
| Latin America |
3.9 |
3.2 |
2.5 |
3.4 |
2.8 |
2.2 |
7.1% |
| Middle East |
2.7 |
2.5 |
2.3 |
2.5 |
2.3 |
2.0 |
2.5% |
| Africa |
5.1 |
4.1 |
3.2 |
5.0 |
4.1 |
3.2 |
2.6% |
| Russia, Central Asia and Southeast Europe*** |
3.1 |
2.1 |
1.2 |
2.1 |
1.5 |
1.0 |
4.1% |
| Emerging and Developing Economies |
5.7 |
4.4 |
3.0 |
4.2 |
3.3 |
2.5 |
52.2% |
| World Total |
4.0 |
3.1 |
2.2 |
3.3 |
2.6 |
1.9 |
100.0% |
*Europe includes all 27 current members of the European Union, as well as Iceland, Norway, and Switzerland.
**Other advanced includes Canada, Israel, Korea, Australia, Taiwan, Hong Kong, Singapore, and New Zealand.
***Southeast Europe includes Albania, Bosnia & Herzegovina, Croatia, Macedonia, Serbia & Montenegro, and Turkey.
Source: The Conference Board Global Economic Outlook 2013, May 2013 update
Indian Prime Minister Manmohan Singh said the country’s economic slowdown was cyclical and temporary and that pessimism was unwarranted.
Many economists say hurdles to growth stem from the government’s slow pace of policy reforms as well as the country’s crumbling infrastructure and layers of red-tape.
India’s economic troubles are reflected in its gaping fiscal deficit, persistently high inflation and pessimism among businesses and consumers. This has driven down investments and demand.
Uncertainty in developed markets hasn’t helped. India’s exports, which account for about a fifth of its gross domestic product, have slowed sharply over the past year. Meanwhile, the country’s import bill has swelled, leading to a record-high current account deficit at 6.7% of GDP in the October-December quarter.
Eurozone is a signal that worst is yet to come ?
Unemployment across the 17 European Union countries that use the euro hit another record high in April – and appears to be on course to hit 20 million this year in what would be another gloomy landmark for the currency bloc.
Eurostat, the EU’s statistics office, said on Friday that the unemployment rate rose to 12.2% in April from the previous record of 12.1% the month before. In 2008, before the worst of the financial crisis, it was around 7.5%.
A net 95,000 people joined the ranks of the unemployed, taking the total to 19.38 million. At that pace, unemployment in the currency bloc – which has a population of about 330 million – could breach the 20 million mark by the end of the year.
The unemployment figures mask big disparities among the euro countries. While over one in four people are unemployed in Greece and Spain, Germany’s rate is stable at a low 5.4%.
The differences are particularly stark when looking at the rates of youth unemployment. While Germany’s youth unemployment stands at a relatively benign 7.5%, well over half of people aged 16 to 25 in Greece and Spain are jobless. Italy’s unemployment rate hit its highest level in at least 36 years to over 40%.
“Youth joblessness at these levels risks permanently entrenched unemployment, lowering the rate of sustainable growth in the future,” said Tom Rogers, senior economic adviser at Ernst & Young.
By contrast the US economy has been growing steadily since the end of its recession in June 2009 and the jobs market has started to improve, with the unemployment rate falling to 7.5% in April.
The asset quality is declining in tandem with the economic cycle : http://www.livemint.com/Opinion/JdBQccPTowuvisdqj9guXN/The-deterioration-in-Indian-banks.html
The financial problems of Indian companies are now being reflected in the asset quality of banks that have lent them money.
The disappointing fourth quarter results announced by the State Bank of India in May are perhaps the starkest example of how the financial condition of Indian banks has deteriorated in tandem with the economic cycle. A recent report by India Ratings and Research, an arm of Fitch Ratings, predicts further deterioration—Rs.1.26 trillion of bank loans may potentially be in distress over the next 12 to 24 months, it says.
The Reserve Bank of India (RBI) has done well to begin making it tougher for banks to brush their problems under the carpet. The central bank on Thursday tightened the rules for corporate debt recasts, asking banks to set aside more money for restructured loans as well as making promoters of companies personally liable for loan losses. This follows an earlier decision in November to increase provisioning for restructured assets.
Non-performing loans have been climbing. The problem of restructured assets has also been increasing over recent quarters. The total value of restructured loans in bank books under the corporate debt restructuring facility was an estimated Rs.2.29 trillion in March. There are an additional Rs.1.7 trillion of loans that have been restructured on a bilateral basis between individual banks and their troubled borrowers, according to unofficial estimates.
Such restructured loans as well as the usual bad loans now weigh down bank balance sheets.
The recent moves to raise the cost of loan restructurings—or the withdrawal of regulatory forbearance—is an implicit signal from the central bank that problem loans will not disappear in a jiffy. It usually makes sense to give lenders breathing space to put their loan books in order when companies are hit by a temporary downturn. A few quarters of leniency can help companies get back to their loan repayment schedules quickly. But it is now increasingly clear that the Indian economy is in the midst of a long slowdown, so banks will need to be far tougher with problem loans.
The rise in problem loans should not come as a surprise. It is the inevitable aftermath of a credit boom, as is the case in other economies as well. Loan growth in India was around twice of nominal gross domestic product in the years that immediately preceded the 2008 crisis, a sure sign of effervescent lending. Part of this unusual buoyancy in lending can be explained by the decisions taken within banks but the pressure from New Delhi to step up lending in those exuberant years was also a factor. This is the moment of the inevitable hangover.
What now? A quick improvement seems unlikely. First, it seems that India has still not seen the bottom of the credit cycle. Second, the standard metrics on the ability of companies to service their debt (such as interest cover and free cash flow) are also flashing amber. Third, a sharp reduction in interest rates seems unlikely despite the unexpectedly sharp drop in inflation in recent months. Our assessment is that asset quality in Indian banks will continue to deteriorate for at least a few more quarters (though rising bond prices as a result of a fall in long-term yields could provide some buffer to banks that collectively own more than a quarter of their assets in bonds).
The asset quality of banks is closely related to the state of the underlying economy, which is now in the midst of a structural slowdown. The recent regulatory tightening should be examined against this backdrop, as a recognition of the true state of the Indian economy.
Investors too should welcome the stricter measures, because the regulatory forbearance we saw after 2009 was an attempt to postpone the day of reckoning, when a bank has to take a hit from its problem loans.
FDI inflows declining and rupee depreciating
http://www.thehindu.com/business/Economy/fdi-dips-by-38-to-224-bn-in-201213/article4775276.ece
Government’s efforts to promote India as an investment destination does not seem to be yielding fruits as FDI inflows registered 38 per cent decline to $22.42 billion in 2012-13 compared to the previous year.
FDI inflows were worth $35.12 billion in 2011-12.
The government had taken several policy decisions in the past few months to attract foreign investments. Important among these include allowing FDI in multi-brand retail and civil aviation sectors and seeking legislative approval for increasing FDI cap in insurance and pension sectors.
In March this year, the country had attracted $1.52 billion FDI, taking the total to $22.42 billion in the entire financial year, an official in the Department of Industrial Policy and Promotion (DIPP) told PTI.
Sectors which received large FDI inflows during 2012—13 include services ($4.83 billion), hotel and tourism ($3.25 billion), metallurgical ($1.46 billion), construction ($1.33 billion), automobiles ($1.53 billion) and Pharmaceuticals ($1.12 billion), the official added.
India received maximum FDI from Mauritius ($9.49 billion), followed by UK ($7.87 billion), Singapore ($5.25 billion), Japan ($2.97 billion) and United States ($1.11 billion).
According to industry experts, there is a need to improve business environment in the country.
In November 2012, India attracted FDI worth $1.05 billion, which was two—year low.
India would require around $1 trillion in the next five years to overhaul its infrastructure sector such as ports, airports and highways to boost growth.
Decline in foreign investments could put pressure on the country’s balance of payments and may also impact the value of the rupee.
Rupee declined by 12 paise to end at 11—month low of 56.50 against the US dollar on Friday amid worries over current account deficit and GDP growth.
With FII outflows of $90 million in stocks, RBI’s poor inflation outlook and GDP growth rate falling to decade’s low of 5 per cent pushed the rupee downwards to 56.76 — its lowest since June 28, 2012.
Economic growth rate slipped to a decade low of 5 per cent in 2012—13 due to poor performance of farm, manufacturing and mining sectors.
GDP growth in Jan- March is a mere statistical growth due to base affect ?
Has the economy turned the corner? That’s the big question the gross domestic product (GDP) numbers were supposed to answer. Has it indeed bounced off a bottom? At first glance, the answer to that question seems to entirely depend on your measuring rod. For instance, if we take the quarterly estimates of GDP at 2004-05 market prices from the expenditure side, we find real GDP growth was 3.4% in the June quarter, 2.5% in the September quarter, 4.1% in the December quarter, and 3% in the March quarter. By that yardstick, the economy hit a bottom in the September quarter of 2012-13, bounced back in the next, and then fell back again in the March quarter. The rather dubious consolation is that this yardstick is well known to be dodgy and the credibility of the expenditure-side GDP figures is rather low.
Going back to the more credible GDP data at factor cost, we find growth was 4.8% in the March quarter, a mite higher than the nadir of 4.7% reached in the preceding quarter. That would indicate that the economy has indeed bounced off a bottom, a very weak bounce, more of a twitch really.
The problem, as usual, lies in the base effect. It’s true that real GDP growth at factor cost was 4.7% in the third quarter and 4.8% in the fourth quarter compared with a year ago. That 4.7% growth was on top of 6% growth in the third quarter of 2011-12, while the 4.8% growth was on top of a much-lower 5.1% growth in the fourth quarter of 2011-12. Even the feeble bounce was entirely statistical.
The same holds true for several of the sectors. Growth in manufacturing, for example, has moved up slowly and steadily from minus 1% in the first quarter of 2012-13 to 2.6% in the fourth quarter. That looks like a decent recovery. The problem is that in the first quarter of 2011-12, manufacturing growth was 7.4% and it was a mere 0.1% in the fourth quarter of that year. In short, the entire credit for the growth in manufacturing goes to the base effect.
Apart from agriculture, with its seasonal vagaries, are there any sectors that have bucked the base effect? The financing, insurance, real estate and business services segment seems to have done just that. It grew by 9.1% in Q4, 2012-13, on top of 11.3% growth in the year ago quarter. Compare that to its much-lower 7.8% growth in Q3, 2012-13, on top of 11.4% growth in the year ago quarter.
On the other hand, there are several sectors that have done badly in spite of a favourable base effect. Consider electricity, gas and water supply, whose growth rate has gone down from 4.5% in the third quarter of 2012-13 to 2.8% in the fourth, although growth in this sector in Q4 of the previous year was much lower than in Q3 that year. This clearly shows the impact of supply-side problems in the power sector. Similarly, growth in trade, hotels, transport and communication slackened a bit in the fourth quarter compared with the third, despite a favourable base effect. Community, social and personal services, a proxy for government expenditure, unsurprisingly saw tepid growth as the fiscal deficit came down.
How much did the different sectors of the economy contribute to GDP growth in 2012-13? As much as 35% of the growth was generated by the trade, hotels, transport and communication sector, closely followed by financing, insurance, real estate and business services, which accounted for 31.3%. The community, social and personal services segment contributed 16.8% of the growth. It means these three service sectors contributed a huge 83.1% to growth last fiscal year.
Contrast the miserable performance of manufacturing, which accounted for a mere 3.3% of growth. The construction sector contributed more than double that. As a matter of fact, agriculture, forestry and fishing generated 5.4% of last year’s growth, more than the share of manufacturing. The contribution of the mining sector was negative, because of the court-directed closure of mines. The chart shows the contribution from the different sectors. Clearly, mining is the weakest link, closely followed by manufacturing.
The Central Statistical Organisation also seems to have been bang on target with its estimate of 5% real GDP growth at factor cost for 2012-13. A closer examination shows, however, that it had overestimated growth in manufacturing, mining, electricity, gas and water supply and, to a minor extent, in community, social and personal services, and underestimated growth in trade, hotels, transport and communication. That the overall growth rate came out exactly as it predicted can be attributed to an extraordinary stroke of luck.
India’s growth slows down – India is running out of fuel ?
The Indian economy grew at its slowest pace in a decade in 2012-13, posing another fresh challenge for the UPA coalition to revive growth and boost sentiment ahead of the general elections next year.
Data released by the Central Statistical Organization (CSO) on Friday showed that the economy grew 5% in 2012-13, compared to 6.2% expansion in the previous year. It was in line with the advanced estimates released earlier.
The economy grew 4.8% in the January-March period, the fourth quarter of the 2012-13 fiscal year, marginally above the upwardly revised 4.7% expansion in the previous quarter, providing some hope of a tentative turnaround. But the overall economic scenario still remains challenging and the GDP data should come as a wake-up call for the government.
The CSO numbers are also an embarrassment for the finance ministry which had questioned the statistics office’s methodology and expressed doubts about the advanced estimates.
The finance ministry had slammed the CSO for forecasting 5% growth for 2012-13. Finance minister P Chidambaram had said the estimate of 5% was based on “dated data”. He had said that growth would be closer to 5.5% and had exuded confidence that green shoots of recovery were visible in the economy.
The high current account deficit, which widened to 6.7% in the December quarter, and stubborn inflation has acted as obstacles to easing monetary policy aggressively. While the Reserve Bank of India has cut interest rates it has cautioned about the persisting inflationary pressures and risks still facing the economy.
What has been most disappointing is that industrial output growth in 2012-13 has been a mere 1%, posing a threat to job creation and overall growth.
Friday’s data showed the farm sector rose 1.9% in 2012-13 compared to 3.6% in the year-ago period while the crucial manufacturing sector grew 1% compared with 2.7% expansion in 2011-12.
The services sector, which accounts for nearly 60% of the economy, rose 7.1% in 2012-13 compared to 8.2% growth in the year-ago period.
CDR gives an indication that the corporate sector is crashing !
The latest data from the CDR cell suggests that Indian banks added Rs. 15,016 crore of restructured loans in the March quarter, about Rs. 9,000 crore less than what they had done in the pre ceding quarter. On a cumulative basis, total restructured loans crossed Rs. 2.27 trillion, or 4.4% of the total loans given by Indian banks.
Indian banks have been hit by a surge of bad loans in the face of declining economic growth, estimated at a decade’s low of 5% in the year ended 31 March, project delays and high interest rates that have made it difficult for borrowers to repay debt. Lenders have been easing repayment terms to avoid classifying them as bad assets.
The CDR numbers do not reflect the actual pile-up of restructured loans in the banking system because lenders also recast loans outside the CDR platform, on a bilateral basis.
The aggregate figure for bilateral loan recasts is not available, but bankers said such recasts may nearly equal the CDR figure. That would take the total restructured assets of the Indian banking industry to around Rs.4 trillion.
In the whole of fiscal 2012-13, Indian banks restructured a total of Rs.77,101 crore of loans through the CDR route, nearly double the amount in the previous fiscal (Rs.40,000 crore). Analysts expect about 25-30% of such loans to turn bad.
Iron and steel contributed most to the restructured loan pile—23%—followed by infrastructure (9.65%) and power (8.13%). The textile, telecom and fertilizer sectors, and non-banking finance companies, too, are high on the list.
Despite a decline in the CDR numbers in the March quarter, bankers and financial sector analysts are sceptical about a sustainable revival at Indian companies. The pain associated with mounting bad loans is unlikely to ease at least in the next six months, they said.
Gross non-performing assets (NPAs) of 40 listed Indian banks rose to Rs.1.79 trillion in December fromRs.1.25 trillion a year ago, an increase of 43.1%. In the past, the Reserve Bank of India (RBI) had cautioned banks about the need for enhanced risk assessment tools to monitor loan quality.
Factory output shrinks 1st time in over 4 years .
http://in.reuters.com/article/2013/06/03/india-manufacturing-pmi-idINDEE95203N20130603
The sombre PMI findings came hard on the heels of data released on Friday that confirmed Asia’s third largest economy grew at its slowest pace in a decade in the fiscal year that ended in March.
The overall HSBC Manufacturing Purchasing Managers’ Index (PMI), which gauges business activity in Indian factories but not its utilities, sank to 50.1 in May from 51.0 in April, and was the third straight monthly fall.
Though the May reading was the lowest since March 2009, the overall index has held above the watershed 50 level that divides growth from contraction for over four years.
The reading for the factory production sub-index, however, showed output contracted in May from a month earlier as new orders growth slowed to a trickle. The output sub-index fell to 48.6 in May from 50.2 in April.
“Economic activity in the manufacturing sector slowed further in May as output contracted in response to softer domestic orders,” said Leif Eskesen, an economist with survey sponsor HSBC. Eskesen said power outages added to the drop in production
Defaults in Agricultural credit in another bubble ?
A surge in exposure to farm debt through Kisan Credit Cards (KCCs) could emerge as a risk for India’s state-run banks, according to experts.
Subsidized loans are given to farmers through KCCs by state-owned banks. Until March 2012, the outstanding amount on such loans was Rs.1.6 trillion through 20.3 million cards, as per the latest Reserve Bank of India (RBI) data. This may have risen to around Rs.2 trillion, bankers said.
Bad loans may be piling up at banks, but they don’t reflect on the books as the credit limit on such cards keeps increasing. Even if a borrower fails to pay up and the banks add the unrealized interest to the exposure because of the rising credit limits—typically 10% every year—the so-called capitalization of interest does not affect the status of the loan account.
State Bank of India (SBI) has the largest exposure to KCC loans—about Rs.44,000 crore— and 5% of this has turned bad, the bank said; Central Bank of India’s exposure isRs.8,428.05 crore and that of Bank of Maharashtra is Rs.2,045 crore.
According to RBI data, banks had Rs.33,200 crore overdue in the direct agrifinance portfolio till 2011 June. The latest figures are not available.
The credit culture in rural India deteriorated sharply after the government announced a Rs.70,000 crore debt waiver for farmers in the February 2008 budget.
The farm loan waiver was one of the United Progressive Alliance government’s key programmes in its first tenure and at least partly responsible for its return to power in 2009.
“Outstanding KCC loans have grown at around 33% in past two years while the number of credit cards has grown at around 13%,”
The share of agriculture, which once generated maximum jobs, has been shrinking as a percentage of national income in Asia’s third largest economy—from 35.75% in 1981 to 16.75% in 2012.
Agriculture is one of the largest sources of bad loans for most banks. It is contributing 9.72% to the gross NPAs of SBI and 7% of Central Bank of India. The nation’s largest lender SBI has the largest gross NPAs —Rs.53,457.79 crore, or 5.3% of loans, followed by Punjab National Bank (Rs.13,997.82 crore, or 4.61% of loans), Central Bank of India (Rs.8,938.47 crore, or 5.64% of loans) and UCO Bank (Rs.6,711.29 crore, or 5.53% of loans).
A bad monsoon could mean a dramatic turn for the worse as the June-September rainy season constitutes India’s main source of irrigation.
Brief summary :
And the NPA’s are growing every hour.
10. Gross non-performing assets (NPAs) of 40 listed Indian banks rose to Rs.1.79 trillion in December fromRs.1.25 trillion a year ago, an increase of 43.1%.
11. The total restructured assets of the Indian banking industry could be around Rs.4 trillion.
12. All the emerging or the sunrise industries are not earning enough to pay loans and this clearly shows that India is a oversold story . Iron and steel contributed most to the restructured loan pile—23%—followed by infrastructure (9.65%) and power (8.13%). The textile, telecom and fertilizer sectors, and non-banking finance companies, too, are high on the list.
13. Eurozone is passing through a crises that could worsen, and impact the Indian exporters
14. Rupee is depreciating, and is the worst performing currency in Asia
Overall, I stand by my assessment of the Indian economy in March 2012 (https://commonmansblog.com/2012/03/22/have-we-oversold-the-india-story/ ) and in October 2012 (https://commonmansblog.com/2012/10/11/india-from-emerging-to-a-submerging-economy/ )that India is an oversold story and should prepare for the worst times ahead . Also, I said on my blog in March about India facing a security threat , and we know what China did (https://commonmansblog.com/2013/03/03/economy-downgrade-and-downfall-both-are-a-foregone-conclusion/) .
I see no reason to believe that India will be back to normal before 2015-16, and that too, provided politicians become realistic . In the current environment , none of the political parties or the politicians have a plan to salvage the situation, and my prediction is , that India’s growth rate might fall below 4 % . The Indian Titanic is in mid of a turbulent sea, heading towards a more severe storm . The Titanic is sinking . Can we do something ?
Rajendra Pratap Gupta
Dear Rahul,
Last week you made a statement that , ‘ 50 grams of potato chip are sold for Rs. 10 , and that this is made from just half potato’ ! Correct ! But again , Rahul don’t forget that the foreign companies no lesser than Wal-Mart ( likes of Pepsico ) are selling these expensive potato chips made from half a potato . So, does it not make more sense to check the growth of MNC retail chains / companies in India, who are buying cheap potato but ‘profiteering’ by selling chips at Rs. 10 per packet and the poor farmer is losing his produce at a throw away price ?
Also, I wish to draw your attention towards the fact that currently the farmers are paid Rs. 1 per KG. I cannot understand why will ‘Profit & balance sheet obsessed’ Retail chains pay more to these poor farmers !
Simply stating that the middlemen would be removed and so farmers will get more, is a fallacious statement and conveys a lack of your ignorance about the realities. I think your party and Maya ji are fighting in the ‘aerial warfare’ with no touch of realities on the ground
I read another news that Rae Bareilly will get a commercial airport
Let me enlighten you about the Awadh region where your dad , mom & yourself have fought & won elections for decades
The Awadh region once ruled by nawabs and taluqdars and known as granary of India because of its fertile Gangetic plain. The area has given prime ministers to the country – Indira Gandhi, Rajiv Gandhi, and Atal Bihari Vajpayee. But most districts are still backward.
Population | 3.654 Cr
Per Capita Income | Rs 13,150.81
Faizabad division | Faizabad, Ambedkar Nagar, Sultanpur, Chhatrapati Shahuji Maharaj Nagar, Barabanki
Devipatan division | Gonda, Balrampur, Shravasti, Bahraich
Kanpur division | Kanpur, Ramabai Nagar, Auraiya, Farrukkhabad, Kannauj, Etawah
Lucknow division | Lakhimpur, Lucknow, Sitapur, Hardoi, Unnao, Rae Bareli
Now here is an interesting fact : Purulia is better off than Rae Bareli and Amethi and this was quoted in this article of Business Standard & Mid-Day. http://www.mid-day.com/poll2009/2009/apr/270409-Purulia-is-better-than-Amethi-Left-tells-Rahul.htm
Let me walk you through a planning commission report on the per capita domestic product , and the NDP per capita in your family’s constituency.
Net domestic product (total and per capita) 2006-7 as per planning commission, Government of India
| At Current Prices | At Constant Prices 1999-2000 | |||
| Domestic Product (Total) Rs. in CR. | Per Capita Domestic Product (Rs.) | Domestic Product (Total) (Rs. in Cr.) | Per Capita
Domestic Product (Rs.) |
|
| Rae Barielly | 3288 | 10361 | 2489 | 7844 |
| Sultanpur | 3955 | 11168 | 3077 | 8687 |
So clearly, getting an airport in Rae Barielly is a stupidity of the highest order, and that too, when it is clear that the region is back ward and people can barely survive a year without good rains leave alone travelling by air ! Please read the per capita income and check out if the poor people of that district can even afford the air port taxes leave along the airfare !
I have visited Amethi and met up with dozens of self-help groups that you have formed in Amethi, and let me tell you that, you are just ‘Using’ the emotions of these poor people for becoming a member of Lok Sabha from Amethi
While I was travelling to Amethi, none else than your own people (close associates) have informed me that the worst road in India is between Rae Bareilly and Sultanpur. Do I write more!
Learn from Mr. Vajpayee , who started the Golden Quadrilateral project for the Aam Aaadmi and your government is more interested in airports, so that you can fly directly to Amethi rather than taking the 2 hour road drive to Amethi via Lucknow . You are wasting the hard earned money of common men like myself , who earn by hard work and pay 1/3rd of our income as taxes to the government , and people like you go and throw it for things like building an airport at Rae Barielly !
Gandhi Dynasty has taken India back ward by at least 30 years , and we need to stop it soon.
I also don’t understand what is your intent for the so-called ‘Food Security Bill’ and ‘Job Guarantee Bill’. You will give fixed income to people so that they do not have to work and then you guarantee them food ? So it means that people will not have to work and earn the food , and will get it free ? Where will the Rs. 5 lac crore come from for these schemes ? Will these things take India forward or your party men who will get the ration shops to distribute ( read divert ) grains and sell them to the open market, and finally , the poor Aam Aadmi will be left stranded on the road !
Wake up Rahul ! Time will never forgive your people, and the elections will decide your fate not this ‘aerial warfare’ .
Rajendra Pratap Gupta
Healthcare I Retail I Rural Economy I Public Policy
Government’s arguments for FDI in retail are a proof of the fact, that this government does not understand India, and looks at Indians from USA’s businessmen’s perspective. Congress government has become the biggest lobbyist for pursuing the business interest of nuclear & retail corporations from USA & Europe at the cost of India’s middle class
Today’s Economic Times (26th November 2011) headline ‘ Govt Sells Multi-Brand FDI with best bargains’ gives a list of reasons why the government is supporting, (rather pushing FDI ) in retail. Let me put the Common Man’s view and take on each of these arguments
1. It will create 10 million jobs in the next 3 years
A) According to the CII report in 2007, ‘India will need 10 to 12 million skilled workers every year for the next five years to meet the growing demand from the support services and there is a need for strong intervention to ensure the availability of the workforce’. So is the government trying to say that it is only the retail chains that will create 10 million jobs in the next three years?
B) Let us examine how many jobs Wal-Mart created in America & how many jobs did Wal-Mart create in India for the past 3 years of operations both as a wholesaler and as a retailer ? How many jobs our Indian retailers like Future group, Aditya Birla retail and Reliance retail created in the past 3 years? We will clearly see that they did not even create a million jobs!
C) Also, government does not talk how many Kirana stores will shut down in the next 5 years and how many homes will be denied of a source of income ?
D) Wal-Mart or for that matter any retailer works on the least number of workers per square feet (lean management structures ) ,and so it will kill the 50 Kirana stores thereby get at least 250 people out of jobs and then create 50 jobs per super market. Is this factored in the statement? I am willing to prove this in the current retail scenario leave alone the scenario when the foreign retailers come in?
2. Several billion dollars of investment in retail
A) If retail is a great business, the government banks should give loans from domestic financial institutions and let the homegrown retailers grow and build scale and size and let the profits remain in India. Why should we give 51 % of the ownership to foreign players, as these people will sell to Indians and take the profits out of our country. USA / Europe will solve their income and earnings problems and India will get into problems of high inflation and more volatile stock market. Also, Indian retailer being less than 50 % of their share in the retail will become servants to these MNC chains under the current 51 % FDI norms.
B) Why did the government not start with 26 % FDI in multi brand retail for the first five years? Why suddenly start with 51 %. Please justify?
C) Often it has been quoted that the foreign retailers will bring technical know how to Indian retail market and boost the economies of scale and productivity? Which technical know how is the government talking, it needs to explain? I have been a COO / Board member of a major fortune 20 company’s retail operations in India, and I can tell you that these foreign retailers only bring money and no other expertise! They work on high profits, highly automated environment and lean man power structures. So government’s reason of the technical know how is fallacious and is showing that we Indians do not understand retail. Let us look inward and see our home-grown retailers like Future group and Aditya Birla retail .They are certainly growing . Government must bring out a detailed white paper on the so-called ‘Technical Know how’ these foreign retailers bring to Indian retail market?
D) With these billions of dollars coming in India, India’s real estate will become expensive thereby, contributing to keep the inflations levels high for the medium class not just for real estate but for all the sectors
E) Also, these billions of dollars are not charities to India or Indians . These are investments by retailers which follow a ROI ( return on investment concept ) for every dollar spent. So for sure , they people will invest in retail one dollar and take out 10 dollars from India over the next couple of years . Retail is mostly done on inventory management which is on credit from vendors . These retailers follow a credit cycle which ranges from 15 days to over month . So with a double-digit profit margin , these retailers will only be investing one time into infrastructure and then make money without investing at all ,as all the inventory is on a credit cycle . ‘Sell and pay’ is the mantra for these FMCG retailers ! Even the space which is rented by these retailers is leased to product companies for hefty display charges. These retailers charge a heavy fee for listing products in its store before selling .Our policy makers , wake up and understand the real dangerous game of FDI in retail and don’t get carried away by the billions of dollars of investment . It is not true . One time investment by these retailers will be a life long profit for their parent company’s home country
3) Farmers will get more than 12-15 % of the consumer price they get for fruits and vegetables
A) In reality, farmers will never get a higher price but will be exploited by these MNC Chains .In fact, these MNC retailers will push in for stringent quality checks and other prohibitively expensive conditions for these farmers thereby, forcing the poor Indian farmer out of his livelihood. Most of the retailers will take to contract farming, and thus the farmers will be reduced to being laborers in the hands of these MNC chains.
B) The History of these MNC chains has shown the these chains are out to squeeze blood out of their vendors and farmers will certainly be vendors for these MNC chains and nothing else . Wal-Mart and other retailers are facing dozens of cases of exploitation and gender bias in developed country where the legal system is strong . Imagine what will happen in our country ?
4) Consumers will get producers at Cheaper Prices, as competition will bring down the prices
A) Even without competition the prices will come down by a few paisas or may be a few rupees, but, all these chains will increase the MRP (Maximum retail prices) of the products, and so the consumer will end up paying more than what s/he pays today. Take an example of the MNC pharma companies. Since there is a ceiling of price increase by 10 %, so every year the pharma companies increase the prices by 9-9.5 % and thereby, circumventing the price increase regulations.
B) It is clear that the consumer is not a winner, no one pay’s from its pocket OR profits to the consumer. If there is a price increase on the input costs, the same is passed on to the as an increased MRP or the quantity is reduced for the same price. So the consumer’s pocket is always ripped apart by these retailers
5) 30 % mandatory sourcing from small-scale sector will help small industry
A) This has not been a convincing argument, so we are trying to tell that a small company out of Varanasi will compete with HUL and win? Come on Dr.Manmohan Singh, are you trying to fool Indians? I understand that you studied at Oxford, doesn’t mean that rest of the Indians are going to get carried away with these statements
B) Also, these MNC chains will put conditions that are either too stringent to be complied to or prohibitively expensive to be implemented by these SME’s, and so finally, these chains will find a reason to evade buying from these SME’s. Also, that the SME’s are not just limited to India, but across the world, so probably, Chinese SME’s would benefit more than Indian SME’s
C) These retailers charge a heavy fee for listing products in its store before selling. How will SME’s afford that ? The fee currently for Indian retailers varies from few thousand to over a lac for products for companies . SME’s will never be able to benefit from these chains even if they are able sell to them, as they will pay for listing and then cry for the payment – which will depend on the vendor payment cycle varying for weeks to months and small vendors (SME’s ) cannot survive this big box retail game
6) 70 % of retail is in food items and these are mostly sourced locally
A) If 70 % of the retail is in food items and this is sourced locally, why allow 51 % of the profits to go out of India? So FDI should not have crossed more than 30 %!
B) Local Indian retailers (existing Kirana stores ) must be trained to deal in these food items and deliver better value for the country and its economy.
C) This argument of the government goes against its own policy. So whereas, 70 % of the products would be food items, 51 % profits from these categories would go out of our country, thereby, clearing pushing the inflation higher perpetually for the next couple of decades. As there will be less money in our country chasing more goods ( as money would have found its way to parent MNC) – Simple economics Mr. Kaushik Basu!
7) Ikea already sourcing 30 % of inputs from India
A) So if Ikea is already sourcing 30 % inputs from India, let other chains also do the same before starting their shop in India.
B) If these MNC chains buy from India and sell in India and take 51% of the profits abroad, what is India’s gain? The government must come out clean on this?
8) Approval only after investors meet all conditions, including 50 % investment in back end
A) This statement of investment in backend is a foolish statement. Already 100 % FDI is allowed in wholesale, why justify it for retail and link it up? Let these retailers first invest in back-end for the first five years and next five years invest in front end
B) Government has FCI (Food corporation of India) godowns and what is the government doing for enhancing the efficiency of this biggest warehousing corporation – Can this FCI not become the Cash and Carry for small retailers ? A drastic improvement in supply chain of FCI godowns can bring down the wastage of food grains by hundreds of tons if not thousands of tons. Please pursue the project of Mr.Atal Behari Vajpayee of Golden Quadrilateral and link up all the FCI godowns, and start a national Agriculture produce transport corporation to start weekly transport during the harvesting season from the farms to FCI and nearest towns. The farmers co-operative and IFFCO should manage this. With this, farmers will not only get good prices but the wastage will be reduced substantially. Why are you looking at FDI to solve this simple problem of inflation . This can not only solve the inflation problem but also improve productivity at all levels , create more jobs ( may be , millions of low & middle-income but high productivity jobs ) and reduce inflation .
C) Learn from ‘operation flood’ by AMUL and how it solved the shortage of milk problem of our country and created a world-class brand. See what M.S.Swaminathan did with ‘Green Revolution’ to increase the production of grains in our country. Please do not justify that foreign retailers will help you bring down inflation. Remember that ‘Inflation is reversible but FDI is not’ and do not sell our country to foreigners for a short-term gain of a few billion dollars to our economy. This is anyway not the dollars to our economy, but the investment of dollars to take back dollars. I am sure that all these MNC chains a ROI (return of investment) method of calculating the investment returns. So I wish to ask our government that what does the ‘retail FDI dollar’ bring to India, which Indian government cannot do with its own money?
9) Government will have the first right over procurement of farm produce
A) This statement has no value. Government has shown no concern for farmers except considering them as voters and leaving them at the mercy of rain gods.
Questions that the government must answer
Rajendra Pratap Gupta
Healthcare I Retail I Public Policy
Dr.Murli Manohar Joshi
Chairman
Public Accounts Committee
Government of India
6 , Raisena road , New Delhi 110001
Dear Dr.Joshi,
I am sure this finds you fine .It was really nice talking to you yesterday. I wish to submit the following for your kind consideration
Recently , the government has raised Rs. 1.06 Lac Crore from the 3 G & BWA auctions. Though it is a different issue that the government was expecting a modest Rs. 32000.00 Crore from the auction ! The following should be considered
I am sure you will take up these matters in appropriate forums . We look at your leadership in addressing some important issues concerning the nation .
With best regards
Rajendra
Rajendra Pratap Gupta
Email: office@rajendragupta.in
Common Wealth Games – Where are we heading ? Isn’t it the right time to accept failure?
India thought it was a great move to show off and seek the sponsorship for Common Wealth Games. Firstly, it was a wrong decision, as we needed to spend money on accommodating the huts and slums and poor people in NCR, and not on building pools and stadiums and secondly, India is not yet ready to host such events!!
Above all, it appointed a politician Suresh Kalmadi to Chair the same!!
It should be wise to raise hands and accept with the Common Wealth that, we are going to mess with this mega event, and we will face a bigger insult and cause inconvenience and shame for Delhi & Delhites at the cost of immediate priorities. Time to face the moment of truth. Politicians cannot handle even politics, then why give them performance & timelines driven events. We all know the real reason why every politician wants to head the sports body!!
I think , we again took a challenge thinking if China can host Olympics , why can’t India host the Common Wealth !! A wild dream for lethargic and corrupt politicians meddling in sports !!
Time to wake up Dr.Singh and Suresh Kalmadi !
Speech delivered by Rajendra Pratap Gupta at the US-ASIA Business forum at Los Angeles , USA on 12th September 2009 at the Los Angeles Convention Center , LA, USA
Global Economy – in the new world order
Good Morning ladies and Gentlemen
A very interesting session !!
Like an earth quake changes the topography , the recession changes the eco-geography ( Economic Geography ) . Every time a recession has sets in , the world is put on a reset button. We have seen in the past that the earlier recessions have changed the world order. The 20th century recession changed the world .The supremacy of the British empire ended paving the way for a bi-polar world from a uni-polar world. This recession will shift the world order again . It will now change to a multi-polar world . It is a natural progression from a uni-polar world to a bi-polar world to a multi-polar world
For more than a century since the invention of the Steam Engine, America has been a source of inspiration and awe for the world. Today , it is a source of learning and unlearning . It has shown the difference between being ‘Big’ and being ‘Great’.
Over the years , we have also seen the growing interdependence of the developed economies on the developing world.
We have seen how G-4 nations, the group of four biggest economies have, over a period of time expanded to G-5, G-8, G-14 & now G-20. After the recent crises , India, China & other developing economies have been invited to participate and play a role in revival of the Global economy. We are just seeing the economic evolution , which is similar to the Human evolution. It was earlier the survival of the biggest , then came the survival of the fittest and now will be the survival of the most agile & interdependent economies .
We have seen that the corporations that stood tall for over 150 years, collapsed in weeks last year. It had a cascading effect . Companies that were associated with such global corporations suffered huge losses. Nothing is infallible in this dynamic world. We need to have foresight , intelligence & be responsible to keep standing tall.
I see that there has been a lot of hue and cry on outsourcing, and I don’t understand how can people drive the market by such ad hoc policies ? We must not forget that outsourcing was started to create economic, internal efficiencies and customer focus , and this finally lead to Globalization. Globalization is an irreversible process . It is a fact that market conditions drive the economies today. It is more important to see the index of the stock exchange every day and not the GDP of a nation to gauge the market sentiment and the economic outlook. Today, the companies are not driven by market share but by share market . So are the economies. We must not forget that the developed economies or the world class cities & global conglomerates have been built by immigrants and locals working together . Today, this is more relevant . We have moved to an interdependent World
Out sourcing is market driven and it will always exist, where ever companies & countries want to grow .
This year, for the first time, we have seen that about 20000 of the 65000 H1B VISA’s have not been used out of the yearly quota . This signals a drastic shift . Till last year , the applications were over quota on the first few days of the opening . And there used to be a lucky draw for allocating H1B Visa to applicants in India. Suddenly , there are no takers this year. The very ‘brand America’ is hit badly.
Today, there is one world economy interlinked with three category of customers – developed , developing and under-developed countries
The developed countries have reached the peak and are saturated , and growth is going to be marginal . Investments will not be forth-coming in such a scenario and money invested might not yield good returns . The major corporations from the developed world need to support and get support from the rest of the world for future growth.
Developing countries like India & China support more than 2.4 Billion consumers . A great place !! These customers need more investment, and growth & returns would be fantastic . These countries also need to learn from the experience of the developed world , they need knowledge sharing , technology support & investment to scale up and work with the developed world
Under –developed countries; The more we invest, the more better & bigger markets we will be able to create for developed & developing countries . This is the future
Today , the mix of the world economies present a unique synergy and a tremendous opportunity to work together and progress; much more , much faster. There is no competition at all globally , we just require to understand the growth equation in the world order & invest , collaborate and scale much ahead . Horizons are expanding as we are trying to reach them. The world is not just a market where we represent either sellers or buyers , but it is a family knit more closely than ever before . Globalization is not just irreversible but is also indispensible force that drives us together , ahead . Remember , we are equity partners in the global economic progress where wars drive down our returns and growth increases our returns . We know that , today, business interests drive the political decisions . So we require a more close and a strong business relationship between the developed , developing and the under-developed economies to ensure a lasting peace and progress universally.
For more than a decade , America has been a land of opportunity for the rest of the world . Today, the rest of the world is a land of opportunity for America .
I would like to define the developed , developing and under-developed economies as the past , present and future of the new world order and without past , you cannot plan your future !
Two important points to note :
First : There is a reversal of destinations , innovation has moved out of the developed world , as innovation always follows the struggling race. Today , developing and under-developed world houses the world’s best innovative minds & the real consumers . They are the fertile economies . Let’s accept this fact and shape our vision accordingly. The destinations have reversed in the last 15 years and we need to see them as interdependent destinations
Second: You cannot give up outsourcing and still sell your products and services to the developing and under-developed countries. You need to understand that the developing economies are also the consumers. Today China might be a developing economy but also is the biggest lender to America & has 1.3 billion consumers . If China decided to en-cash all the American bonds , the American economy will come down today evening . But we understand that the valuation of dollar is what holds the value of Chinese economy’s reserves. If China decides to en-cash US securities , Dollar will fall and so both the economies will collapse simultaneously. So today , we are closely inter woven and cannot bully a nation. We are partners in progress and partners in downfall alike . Today no country can be independent in resources to meet its population’s needs without interdependence . We depend on oil from Middle East , manufacturing from China & IT & Knowledge from the eastern countries like India . Indian & Chinese economy suffered a hit due to slowing down of the US economy but do you know why Germany slowed down ? Because the Chinese and Indian companies stopped buying heavy machinery from Germany and so was the case with many such countries . It was not just the US economy driving down production , it was also the developing economies that affected the developed world. We have to understand the fact that, it is a either win –win –win or a lose-lose-lose for the interdependent world in today’s equation. The world has come close together like one family during this crisis . We need to use this as an opportunity to develop more understanding for a longer and a deeper global partnership so that we can avoid future recessions . We are all living in a fully integrated and inter-dependent world. It is like a necklace . One weak link can break the entire chain and the necklace will fall off.
Also, America needs to have a re-think on some of its strategies . It needs to invest more on development of the developing world . Just think $ 568 billion was given as aid in S. Africa for the last 42 years and more than $ 642 Billion is being spent on Iraq war . Today the world could have been a much better place & probably out of recession, had the war money gone to the development of the world’s under-developed and developing economies . These could have been the biggest customers for US companies !! We should not forget the point that the majority of the biggest corporations in the world are from America .
Globalization according to me, means a truly interdependent and an intertwined world.
So, it is clear that we live in a truly interdependent world & that we need more even distribution of opportunity and challenges all over the world , and invest more on economic opportunities than enhancing military capabilities; to share more wealth to a much larger mass of population . Thriving businesses can do that faster without much involvement from the government . The forums like US-ASIA business forums must happen more frequently to develop an understanding , partnerships and facilitate a better flow of resources , ideas , goods & services to all the three categories of customers & vice versa
I would suggest my friend Kevin Kaul to take the US- ASIA business forum to a much broader scale and help develop the understanding of interdependence of the new world order between the past , present & future i.e. developed , developing and under developed economies to bring all round progress for the whole world
Thank you and enjoy the rest of your day
Rajendra Pratap Gupta
515-450-8036 (USA)
+91-922 33 44 542 ( India )
+971-553 121829 (UAE )
Email : office@rajendragupta.org
office.rajendra@gmail.com
